The State of Clean Energy – 2023
Total U.S. Clean Energy Jobs
Avg. State Energy Efficiency Score
National Renewable Generation (%)
U.S. Renewable Energy Capacity Added (GW)
Clean energy industries have represented the growth sectors of the U.S. energy economy over the past decade, providing good-paying jobs while supporting a cleaner, healthier future for communities across the nation. The recent passage of major pieces of legislation—the Inflation Reduction Act of 2022, the CHIPS and Science Act of 2022, and the Bipartisan Infrastructure Law of 2021—have contributed to a massive influx of both public and private investment and capital into the clean energy economy.
The Clean Energy Business Network and the Business Council for Sustainable Energy are pleased to release the fourth annual State of Clean Energy, with interactive infographics documenting the clean energy economies across all 50 states and the District of Columbia. The 2023 edition has been reworked over previous years with more comparisons between state-level and national trends, and new data illustrating the impacts of policy.
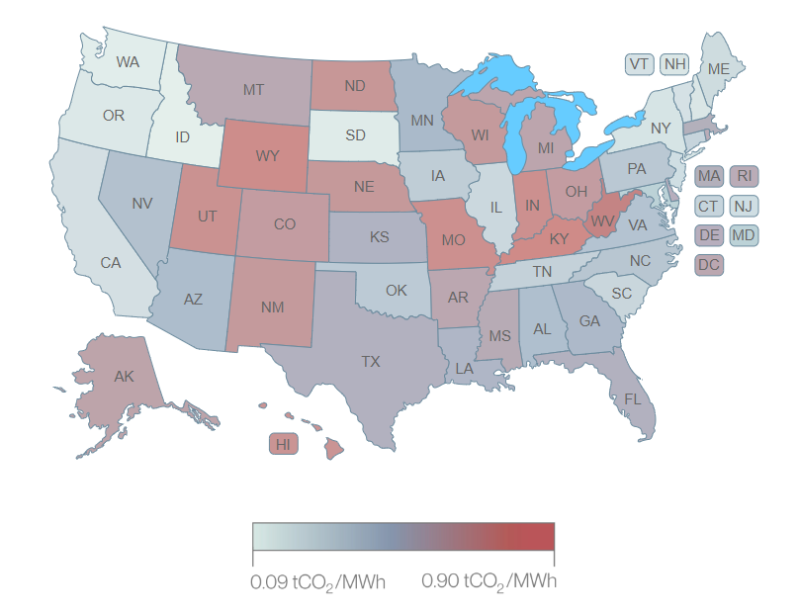
The map below depicts state CO2 emissions rates for the electricity sector. To view the 2023 infographics, visit the current State of Clean Energy page and click on the desired state to see a list of previous years’ infographics.
How does your state stack up in the clean energy economy?

____
The State of Clean Energy This Year
On a nationwide scale, the 2023 Sustainable Energy in America Factbook, produced by BloombergNEF and the Business Council for Sustainable Energy, documents the macro-level trends in the transformation of the U.S. energy economy. Here are some key takeaways on the trends in clean energy in 2022.
- The construction of new renewable energy facilities slowed, but the contribution of renewables to the grid still broke records. The US added 32GW of new renewable power-generating capacity to the grid in 2022. That was down 5GW from the 37GW installed in 2021, which marked the first year-on-year slide in new build since 2018 as developers struggled with tangled supply chains and higher costs. However, the contribution of renewables, including wind, solar, biomass, waste-to-energy, geothermal and hydro, rose at the fastest pace among major sectors. Renewable power jumped to 974TWh from 864TWh in 2021, a 12.6% year-on-year rise. Renewables accounted for 22.7% of total US power generation in 2022–their highest level ever.
- The most important federal investment in the energy transition occurred in U.S. history. In a surprise turn of events in August of 2022, Congress passed the Inflation Reduction Act, the most consequential law ever intended to address climate issues. The law represented a major victory for various clean energy sectors. The IRA provides at least $369 billion in support to energy transition technologies. The law primarily uses tax credits to achieve its goals, estimated at least at $271 billion, over a ten-year time horizon.
- A record-shattering $141 billion in energy transition financing was deployed in the U.S. in clean energy technologies, including renewables, electric vehicles and others. The U.S. is the second largest energy transition investor, with investment rising 11% year-on-year, largely reflecting the growth in electric vehicles sales during the year. EV sales surged 50% to nearly 982,000, or 7.1% of new cars sold.
- U.S. emissions ticked up but remain below pre-Covid levels. U.S. economy-wide emissions inched up 1.0% from 2021, BNEF estimates. This reflected the continuation of a trend begun in 2021 when the economy first began rebounding from the Covid-19 pandemic. Despite the uptick, U.S. emissions in 2022 were still 3% below pre-pandemic (i.e. 2019) levels.
Check out our top ten lists to find out which states are leading the clean energy transition.
____
The State of Clean Energy Archives
View previous years’ map and infographics.
2022
2021
2020
____
About: The State of Clean Energy is a project of the Clean Energy Business Network with assistance from the Business Council for Sustainable Energy. This project is a complement to the Sustainable Energy in America Factbook, produced annually for the Business Council for Sustainable Energy by BloombergNEF. Data sources include BloombergNEF, ARPA-E, ACEEE, the Bipartisan Policy Center, Energy Information Administration, U.S. Energy and Employment Report (USEER), USASpending.gov, Climate Power, and Clean Investment Monitor from Rhodium Group and MIT’s Center for Energy and Environmental Policy Research. See full methodology.
Graphic Design: Anthony Poff

